Cycles rhyme, but they never repeat exactly. If markets were to follow identical price action each time, trading would be simple, and everyone would be a top-tier trader. What’s key to understand is that for any market to precisely mirror a past move, the exact conditions and players would need to repeat their actions to a T—a statistical improbability and practical impossibility.
Over time, we've shown how the current range aligns closely with the 2023 range, highlighting that while we achieved a new all-time high early in the cycle, the timing has stayed remarkably consistent with prior cycles.
The major question now: are we still tracking the previous cycle’s path, or are we starting to deviate?
Given the regularity of Bitcoin’s 4-year cycle, many think “this time is different”—a famously dangerous notion in investing. Still, there’s a strong contingent expecting a top between $100k and $120k in Q1 next year. Personally, I don’t buy into that theory.
Recent market moves have been telling, especially over the past few weeks, about the nature of this cycle. Calling tops is notoriously challenging—indicators and technical signals can mislead even the best, remaining overheated far longer than anticipated. This current range, and the extended summer consolidation, suggests to me that this market is preparing for a longer, sustained climb. This setup, which I pointed out to premium subscribers months ago, will likely cause “max pain” for the majority of participants.
Here’s why: meme coin and speculative hype moves tend to be intense but short-lived. Many expect these runs to last longer, only to see Bitcoin hit a significant high—say, in Q1—followed by another six-month consolidation. When that pullback occurs, traders start calling for a market top, while early gamblers hold on for hope and give back gains.
Then, when BTC rallies again in the second half of 2025, the top-callers FOMO back in, and the gamblers, now with next to no capital, are forced to start fresh.
Now, imagine this scenario repeating until a blow-off top in 2028 or 2029. Gamblers cycle through boom and bust, traders get shaken out repeatedly, and only the true long-term holders of quality cryptos and elite traders endure.
So today, I want to explore why we’re seeing subtle deviations from prior cycles while still echoing familiar patterns.
Longtime readers know we’ve used last summer’s range to make calls on inflection points with exceptional accuracy. However, we’re now starting to diverge from that range in terms of timing. We anticipated a major breakout over the past two weeks, yet it hasn’t materialized. So what’s going on?
Relative Strength Vs Previous Cycles
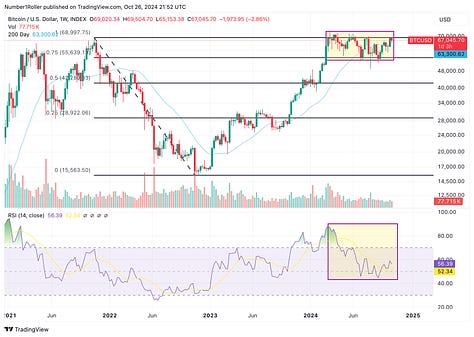
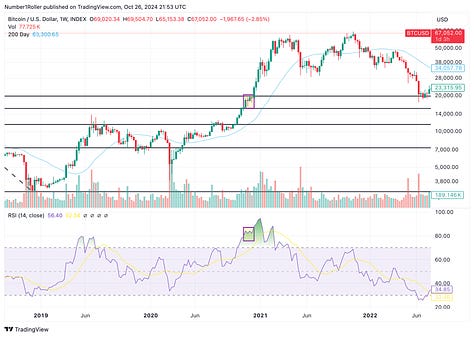
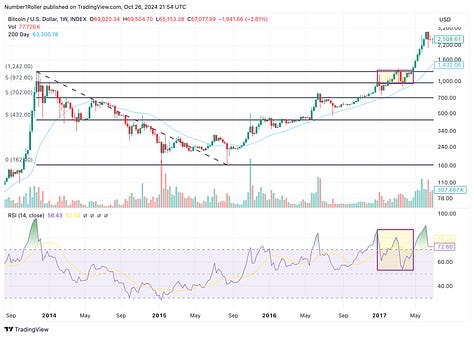
First of all lets look at the relative strength of this cycle vs previous cycles. From a simple retracement perspective we can see that in no other cycle has BTC spent this long consolidating above the 75% level. In 2020 it consolidated below the 50% level. In 2017 there wasn’t as much of a consolidation at all. But generally, the stronger and longer the consolidation phase the bigger the expansion.
Also, notice where the RSI was at in the previous two cycles versus where we are currently. This is a great signal that the market has plenty of room to run before we can consider it getting overheated. RSI is still very low relative to 2020 and 2017. In fact, it looks much more like it did in 2017 which tells us calling a top using this indicator may be a very tricky task going forward.
Price Discovery Phase
If we look at how long it took the market to officially break out from the previous all time high levels and enter the price discovery phase, it would seem that this cycle is starting to realign with previous cycles after an initial expansion that surprised nearly everyone.
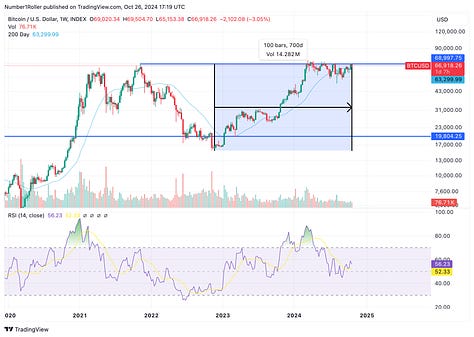
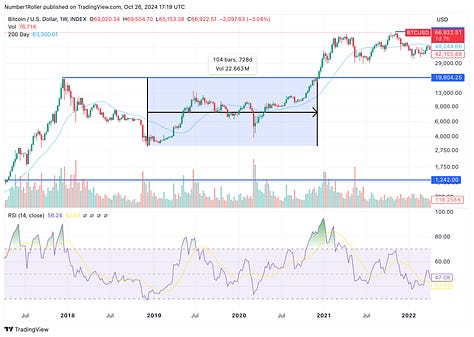

As you can see, the 2017 cycle took 88 weeks from the low to break out, the 2021 cycle took 104 weeks to break out, and this cycle is currently at 100 weeks which is just above the average of these 3 cycles which comes to 97 weeks.
Similarly, if we look at previous top to break out we see a similar pattern but, this time we are on the low side of the average time.
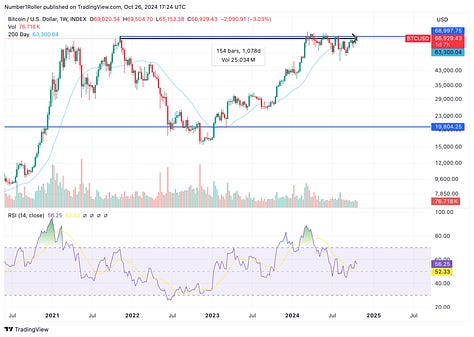
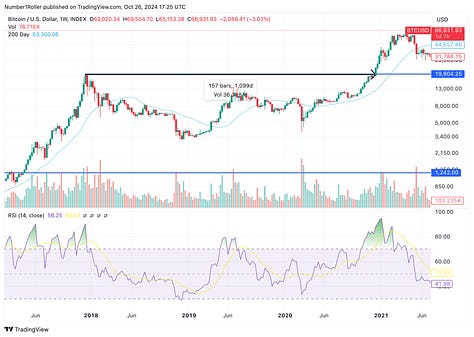
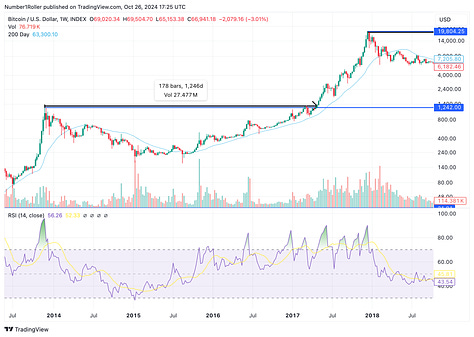
In 2017 it was a 178 week range, 2021 was a 157 week range and we are now at 154 weeks into this cycle which falls below the average of 163 weeks.
So, in short, this reaffirms that we are still very much on track although it has taken slightly longer than anticipated we are just a few weeks between where previous cycles officially began a new price discovery cycle. The fact that this cycle has consolidated for much longer at much higher levels indicated incredible resiliency in this market and likely a very aggressive expansion is coming.
Lastly, lets zoom in a bit on this current cycle and see why BTC is still breaking out and very much in a position of strength as we close out the month of October.
Weekly Retests
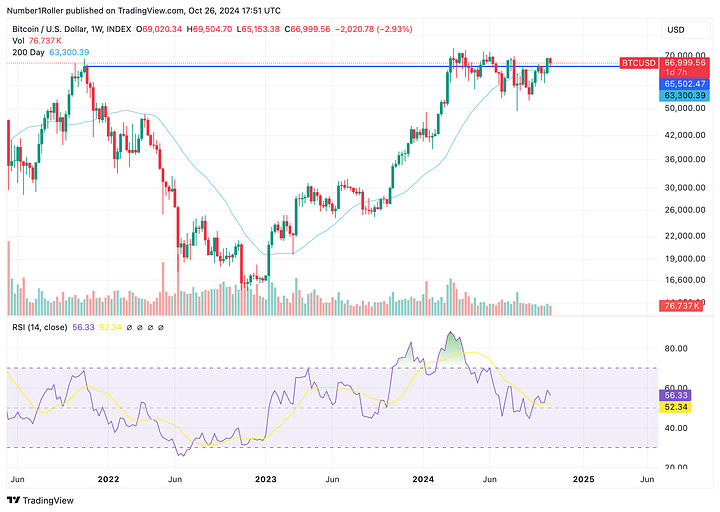
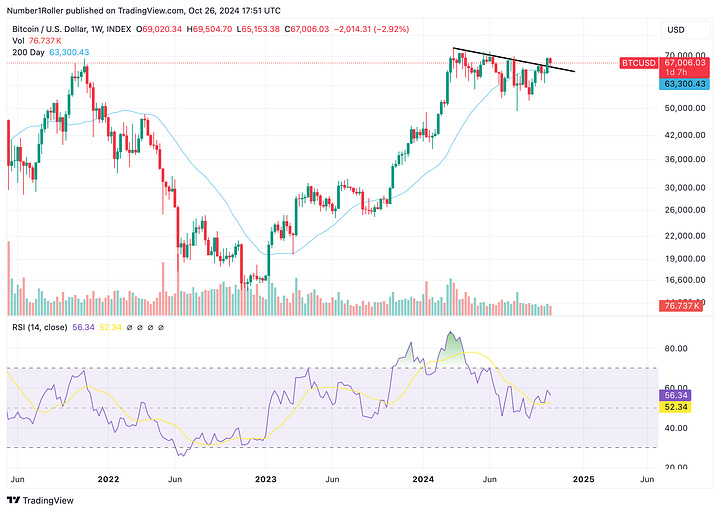
We are sitting on perfect weekly retests of the 2021 ATH on a weekly closing basis as well as the currently weekly range again, on a closing basis. We also have yet to see two or three consecutive weeks down which would be our first major indication of a weakness.
In conclusion, this market has not yet taken off like we expected but it has not yet showed any weakness to suggest further downside. Bitcoin remains in a very strong setup and the longer this grind up continues the longer the cycle will be and the more volatility we will get in 2025.
I still don’t doubt this market can make a new high at any moment as the cycles suggest. However, I also would not be surprised if we kick the can down the road until later in November or December for max frustration. I will discuss in another letter what that may mean for alt coins as BTC.D continues to soar to new highs.

