

This week, I want to focus exclusively on Bitcoin, as I believe we are approaching a pivotal moment. Here's a detailed breakdown of the current market conditions and what to expect in the near future.
Historical Patterns and Current Indicators
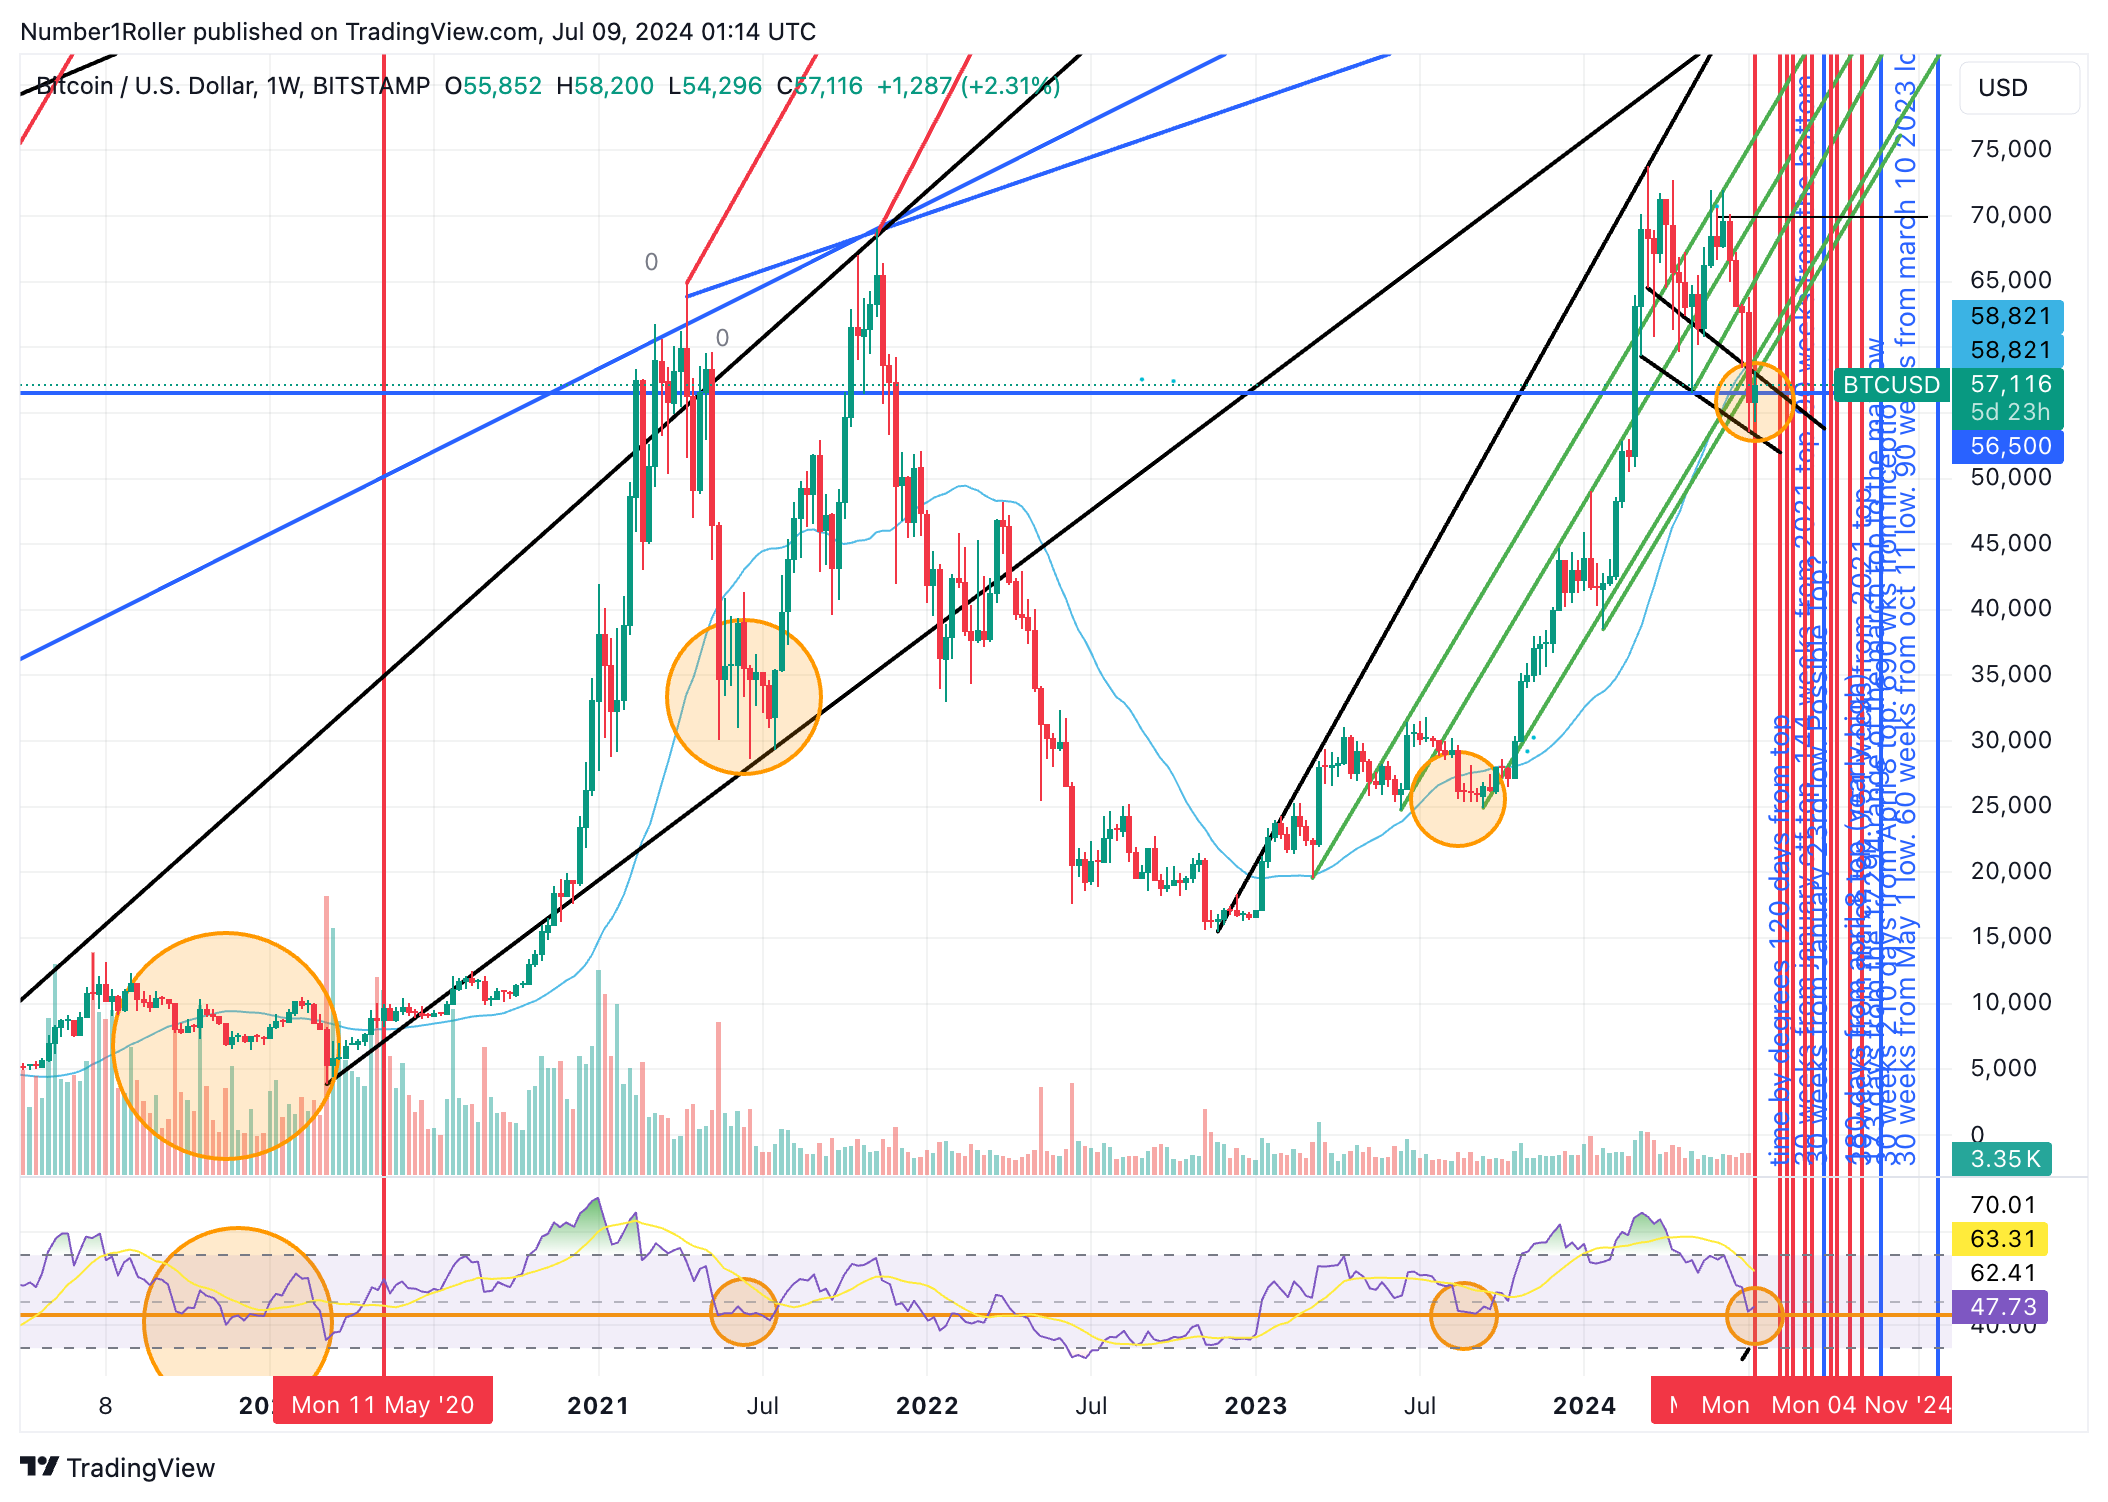
This morning, I mentioned on X that we're observing a unique four-week pattern. Historically, in a crypto bull market, we've never seen four consecutive down weeks without the fifth week turning green and signaling a reversal. This historical trend is working in our favor right now.

Moreover, we have other supporting indicators from a timing perspective. We've seen 48 to 49 days of decline in Bitcoin prices, similar to previous symmetrical moves that also lasted around 48 to 49 days, with declines of approximately 23-24%. These patterns suggest that a reversal is imminent.

Fear and Greed Index

Bitcoin's Fear and Greed Index is currently at 29, indicating significant fear in the market. The last time we saw this level was during the market lows, which often signal a buying opportunity. This level of fear, combined with our timing and price indicators, suggests that we are at or near a significant low.
Weekly Chart and RSI Analysis
However, there's a concerning pattern that we need to discuss. We've been observing a three-wave down pattern on the weekly chart, which typically indicates further declines. The recent lower close adds to this concern, but our four-week pattern gives us promise for a green week and a reversal.


The RSI (Relative Strength Index) has touched a long-term support line on the weekly chart. Historically, in bull markets, this has led to a period of consolidation before a significant move (shown below). We might see Bitcoin moving sideways into the August window, with a potential slight new low before a major recovery (shown in the second image above).
Potential Scenarios
There are two main scenarios to consider:
1. Sharp V-Recovery: Bitcoin could see a sharp recovery to new highs, invalidating the possibility of further panic. This would align with the historical four-week reversal pattern.

2. Gradual Recovery: Alternatively, we might see a gradual recovery without reaching new highs immediately, followed by another decline into a new low. This would represent a worst-case scenario but still offer a good buying opportunity over the coming weeks.


Strategic Outlook
It is our opinion that regardless of the short-term fluctuations, the best strategy here is to accumulate major cryptocurrencies like Bitcoin, Ethereum and Solana. Whether we've hit the low or there’s a slight decline ahead, these assets are currently at a significant discount, providing a great opportunity.
Long-Term View
Looking ahead, my initial outlook from December, which has been remarkably accurate, suggests a major low in early August (around August 6th to 12th). Patience is key during this period. If we see a new all time high before September, it will invalidate any further low and validate a bullish trend and the significance of these dates.
Final Thoughts
In summary, be patient and focus on accumulating majors. The market has several major catalysts ahead and we are entering what is historically one of the most bullish periods of the cycle. Avoid forcing trades and wait for clear bottom signals. Stay updated with our weekly analyses and lookout for promising altcoins and small caps that I'll be sharing with subscribers soon. This period of consolidation could present one of the best buying opportunities of the cycle.


Bitcoin's Critical Juncture: Key Insights and Market Outlook